A growing body of evidence in developed countries has indicated that female disadvantage prevails and persists in mathematics learning outcomes, with the likely causes being social factors, cultural norms, teacher bias, and parental attitudes, among others. Using nationally representative data from India, this article shows that a gender gap exists in mathematics – across age groups, and with no evidence of convergence over time.
Developing abilities in basic mathematics helps improve analytical thinking and logical reasoning skills (Cresswell and Speelman 2020) Performance in and experiences of studying mathematics are also argued as being explanatory factors in the differences among girls and boys in the take-up of STEM (science, technology, engineering, mathematics) subjects in higher education (Breda and Napp 2019). This, in turn negatively affects the prospects of women in the labour market (Hanushek and Woesseman 2008, Dossi et al. 2021), and therefore it is critical to document and track performance and differences in mathematics learning – particularly among girls and boys.
There has been growing evidence documenting the prevalence and persistence of female disadvantage in the subject (Fryer and Levitt 2010, Bharadwaj et al. 2012, Bharadwaj et al. 2016, Lippman and Senik 2018) and its several likely channels –- social factors (Buser et al. 2014, Smetackova 2015), cultural norms (Nollenberger et al. 2016), parental attitudes (Crowley et al. 2019), and teacher bias (Carlana 2019), among others. However, evidence in the context of developing countries including India remains limited, especially on the prevalence and persistence of gender differences in mathematics learning across time, age groups, and geography.
The study
In ongoing research (Das and Singhal 2021), we work towards filling this gap by providing evidence the prevalence and persistence of gender differences in mathematics learning in rural India for children between eight and 16 years of age. We draw from nationally representative learning outcomes data on basic reading and mathematical abilities of over two million children conducted for the Annual Status of Education Report (ASER) from 2010 to 20182.
We complement this with learning outcomes data for rural India from the two waves of the India Human Development Survey (IHDS) collected in 2004-05 and 2011-12, and the fourth round of National Family Health Survey (NFHS-4) collected in 2015-16. The IHDS dataset has similar information on learning outcomes (from the same ASER test), and additionally provides detailed data on socioeconomic and demographic characteristics of the households. This allows us to understand the heterogeneous differences in learning outcomes across households of different characteristics. We use data from the NFHS-4 and first wave of IHDS to understand the relationship of the gender gap with existing patriarchal practices and norms at the household and district level.
Gender differences in mathematics learning
We find a significant female disadvantage in mathematics but not in reading when we pool data from all the surveys from 2010 to 2018 from the ASER dataset. Using the IHDS data, we find these differences to persist across different types of school management (public or private), social groups (religion and caste), economic groups (using income groups), and birth order of children.
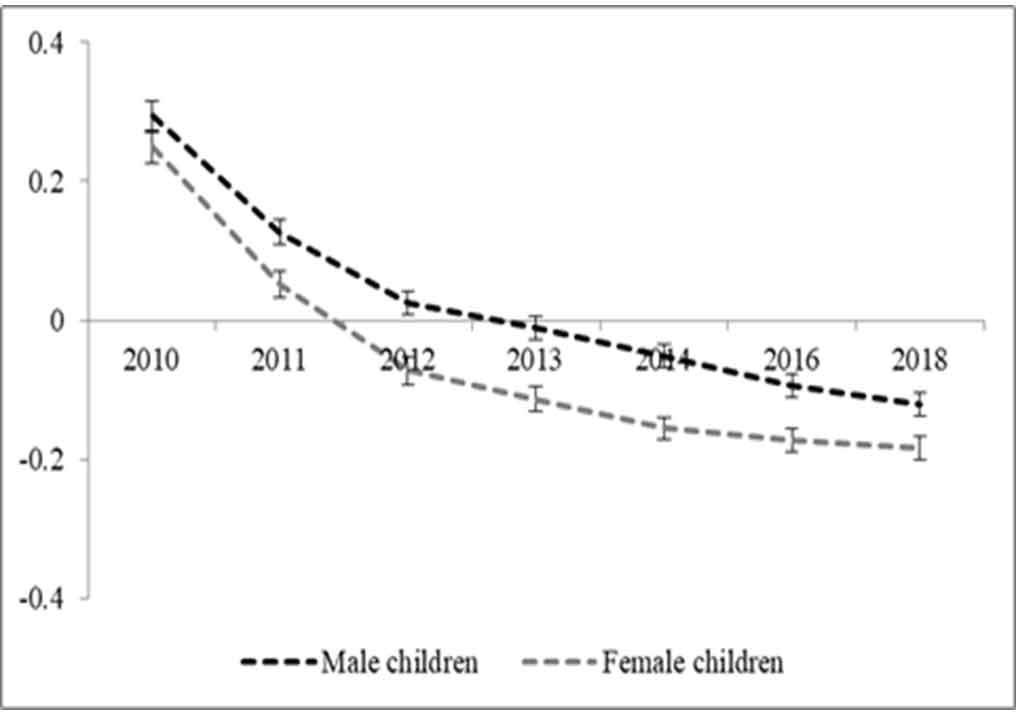
Our temporal analysis measured across ages from 2010 to 2018 indicates that overall, the performance of both girls and boys declined in mathematics and female disadvantage continues to persist across time (Figure 1). In fact, we find no evidence of convergence of this gap over time. However, girls are found to perform better than boys in reading tests in more recent years of our data (in 2018).
Figure 1. Gender differences in mathematics scores across years

Notes: (i) The marginal effects on standardised mathematics score with confidence intervals of 95% are plotted3. The vertical indicates the standardised mathematics score and the horizontal indicates the year of survey. (ii) The sample includes children in the age group 8-16 years from ASER surveys from 2010 to 2018. (iii) The effects are calculated after accounting for household-level economic factors along with village-level characteristics that include whether the village has a post-office, private schools, and health clinics, cemented road etc.
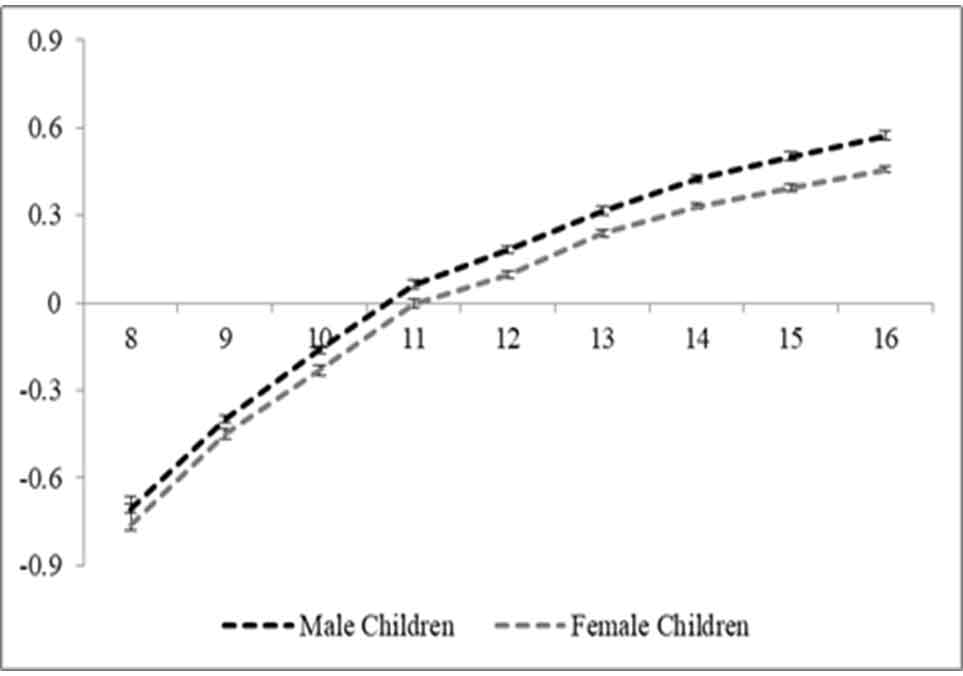
In addition, we find that the gap also persists across age groups and observe a divergence at older ages (see Figure 2). We further try to understand whether these gaps persist for the similar age cohort moving across time4 and find similar differences.
Figure 2. Gender differences in mathematics scores across ages

Notes: (i) The marginal effects on standardised mathematics score with confidence intervals of 95% are plotted. The vertical axis indicates the standardised mathematics score and the horizontal axis indicates the age of the children in years. (ii) The sample includes children in the age group 8-16 years from ASER surveys from 2010 to 2018. (iii) The effects are calculated after accounting for household-level economic factors along with village-level characteristics that include whether the village has a post-office, private schools, and health clinics, cemented road, etc.
Inter-state differences
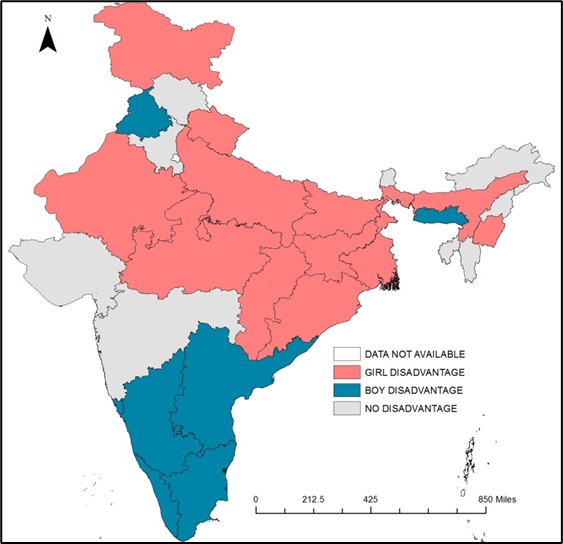
Similar to other studies on gender disparities in education (Kingdon 2005, 2020), we find substantial variation of these differences across states. This is depicted in the state-wise map of India which marks the states which have a prevalent gender gap when the pooled ASER data (2010-18) is used for analysis. We find that almost half the states show significant female disadvantage. As one would expect, these are mainly northern and central states like Uttar Pradesh, Bihar, Madhya Pradesh, Jharkhand, etc.
Figure 3. State-wise gender-based disadvantage

On the other hand, Indian states like Kerala and Tamil Nadu are found to exhibit a ‘reverse’ gap (that is, male disadvantage). While this requires further research, the lack of female disadvantage compared to northern states is not particularly surprising given the differences in contexts, and education-related investments. Evans (2020) has documented pertinent differences between north and south India states – for example, lower labour force participation of women, higher gender segregation in the north, and the prevalence of matrilineal structures in many parts of South India. However, Punjab seems to be an outlier in the analysis as it exhibits male disadvantage despite having gender-related gaps in education that have been similar to other northern states like Bihar, Rajasthan, and Madhya Pradesh (Kingdon 2005).
Patriarchal norms
It is evident from the above differences that states which are largely considered more gender-regressive (based on higher prevalence of patriarchal norms, poorer sex ratios, and other factors) perform worse. We try to understand the same at a more granular level by matching district-level representative data from the NFHS, and using household-level data from IHDS.
From the IHDS survey, we consider two regressive household practices that are associated with higher disadvantage and lower autonomy of women in the house – ghunghat or pardah (practice of veiling their faces), and the practice of women eating after men. From the NFHS survey, we use district-level indicators such as the proportion of households in the district where the husband does not trust his wife with money, tries to limit her contact with her family, gets jealous if she talks to other men, does not permit her to meet friends, and several other such indicators. We find that these factors are significantly associated with gender differences in mathematics scores – female disadvantage is higher among the children in such households and districts with a higher prevalence of the above practices.
Concluding thoughts
The formal recognition in policy of gender gaps in mathematics remains limited. There has been early acknowledgement of these gaps and discussion on potential causes (for instance, attributing better performance of boys to ‘intelligence’ and of girls to ‘hard work') by the National Curriculum Framework set up by the National Council of Educational Research and Training (NCERT, 2005). However, there seems to be a lack of systematic recognition or effective policies to indicate that these concerns have been addressed.
Even the recently passed New Education Policy (NEP) does not acknowledge these gender-based differences, despite its push towards children developing foundational literacy and numeracy (FLN) in early years. There is a need to understand these differences and think more carefully about the kind of support required to alleviate this. Many states have built capabilities to gather data on learning outcomes of children (for example, Gunotsav5 in Assam and Gujarat, and Pratibha Parv in Madhya Pradesh). However, it is critical to ensure that the assessments are reliable and are able to inform actionable insights for policy, including decentralised inputs to district/block-level officials and teachers to respond to these issues.
Notes:
- Singh and Krutikova (2017) document growing gender differences from pre-primary/primary to secondary stages across four countries (the states of Andhra Pradesh and Telangana in India). Using the same dataset, Rakshit and Sahoo (2020) find evidence for teacher bias. Muralidharan and Seth (2016) document the role of teacher gender and growing differences across grades.
- ASER is an annual nationally representative survey (also representative of the districts covered), where all children between 5 and 16 years are tested on basic reading and mathematics. These tests capture grade two or grade three level proficiency that a typical seven or eight year old should be able to answer correctly. The survey also captures information about the child's school, household, and village. Please see the official website for more details.
- A 95% confidence interval is statistical way of presenting uncertainty about estimated effects. It implies that if the tests are conducted repeatedly with new samples, for 95% of the times, the true effect would lie within the confidence interval. Standardised score measures how different is the child’s score from the others on average. It is obtained by subtracting the actual score with the sample mean and then dividing it with the standard deviation.
- We do this by pooling those who are eight years old in 2010, nine years old in 2011, 10 years old in 2012, and so on.
- See Mody(2018) and Singh (2020) for concerns on the accuracy of Gunotsav(Gujarat) and Pratibha Parv, respectively.
Further Reading
- Bharadwaj, P, GD Giorgi, D Hansen and C Neilson (2012), ‘The Gender Gap in Mathematics: Evidence from Low- and Middle-Income Countries’, NBER Working Paper No. 18464.
- Bharadwaj, Prashant, Giacomo De Giorgi, David Hansen and Christopher A Neilson (2016), “The Gender Gap in Mathematics: Evidence from Chile”, Economic Development and Cultural Change, 65(1): 141-166.
- Breda, Thomas and Clotilde Napp (2019), “Girls’ comparative advantage in reading can largely explain the gender gap in math-related fields”, Proceedings of the National Academy of Sciences, 116(31): 15435-15440.
- Buser, Thomas, Muriel Niederle and Hessel Oosterbeek (2014), “Gender, Competitiveness, and Career Choices”, The Quarterly Journal of Economics, 129(3): 1409-1447.
- Carlana, Michela (2019), “Implicit Stereotypes: Evidence from Teachers’ Gender Bias”, The Quarterly Journal of Economics, 134(3): 1163-1224.
- Cresswell, Clio and Craig P Speelman (2020), “Does mathematics training lead to better logical thinking and reasoning? A cross-sectional assessment from students to professors”, PLOS ONE, 15(7): e0236153.
- Crowley, Kevin, Maureen A Callanan, Harriet R Tenenbaum and Elizabeth Allen (2001), “Parents Explain More Often to Boys Than to Girls During Shared Scientific Thinking”, Psychological Science, 12(3): 258-261.
- Das, U and K Singhal (2021), ‘Solving it correctly Prevalence and Persistence of Gender Gap in Basic Mathematics in rural India’, arXiv preprint (arXiv:2110.15312).
- Dossi, Gaia, David Figlio, Paola Giuliano and Paola Sapienza (2021), “Born in the family: Preferences for boys and the gender gap in math”, Journal of Economic Behavior & Organization, 183: 175-188.
- Evans, A (2020), ‘Why are North and South India so different on gender?’, 6 October. Fryer Jr., Roland G and Steven D Levitt (2010), “An Empirical Analysis of the Gender Gap in Mathematics”, American Economic Journal: Applied Economics, 2(2): 210-240.
- Hanushek, Eric A and Ludger Woessmann (2008), “The Role of Cognitive Skills in Economic Development”, Journal of Economic Literature, 46(3): 607-668. Available here.
- Kingdon, Geeta Gandhi (2005), “Where Has All the Bias Gone? Detecting Gender Bias in the Intrahousehold Allocation of Educational Expenditure”, Economic Development and Cultural Change, 53(2): 409-451.
- Kingdon, Geeta Gandhi (2020), “The Private Schooling Phenomenon in India: A Review”, The Journal of Development Studies, 56(10): 1795-1817.
- Lippmann, Quentin and Claudia Senik (2018), “Math, girls and socialism”, Journal of Comparative Economics, 46(3): 874-888.
- Mody, A (2018), ‘Nine years on, Gujarat’s Gunotsav school assessment scheme isn’t really improving education quality’, Scroll, 12 April.
- NCERT (2005), ‘National Curriculum Framework 2005’, Report.
- Muralidharan, Karthik and Ketki Sheth (2016), “Bridging Education Gender Gaps in Developing Countries: The Role of Female Teachers”, Journal of Human Resources, 51(2): 269-297.
- Nollenberger, Natalia, Núria Rodríguez-Planas and Almudena Sevilla (2016). “The Math Gender Gap: The Role of Culture”, American Economic Review, 106(5): 257–261.
- Rakshit, S and S Sahoo (2020), ‘Biased Teachers and Gender Gap in Learning Outcomes: Evidence from India’, GLO Discussion Paper.
- Singh, A and S Krutikova (2017), ‘Starting Together, Growing Apart: Gender Gaps in Learning From Preschool to Adulthood in Four Developing Countries’, MINISTERIO DE EDUCACIÓN, Working Paper.
- Singh, A (2020), ‘Myths of Official Measurement: Auditing and Improving Administrative Data in Developing Countries’, RISE Working Paper 20/042.
- Smetáčková, Irena (2015), “Gender Stereotypes, Performance and Identification with Math”, Procedia – Social and Behavioral Sciences, 190: 211-219.
Social media is bold.
Social media is young.
Social media raises questions.
Social media is not satisfied with an answer.
Social media looks at the big picture.
Social media is interested in every detail.
social media is curious.
Social media is free.
Social media is irreplaceable.
But never irrelevant.
Social media is you.
(With input from news agency language)
If you like this story, share it with a friend!
We are a non-profit organization. Help us financially to keep our journalism free from government and corporate pressure


0 Comments